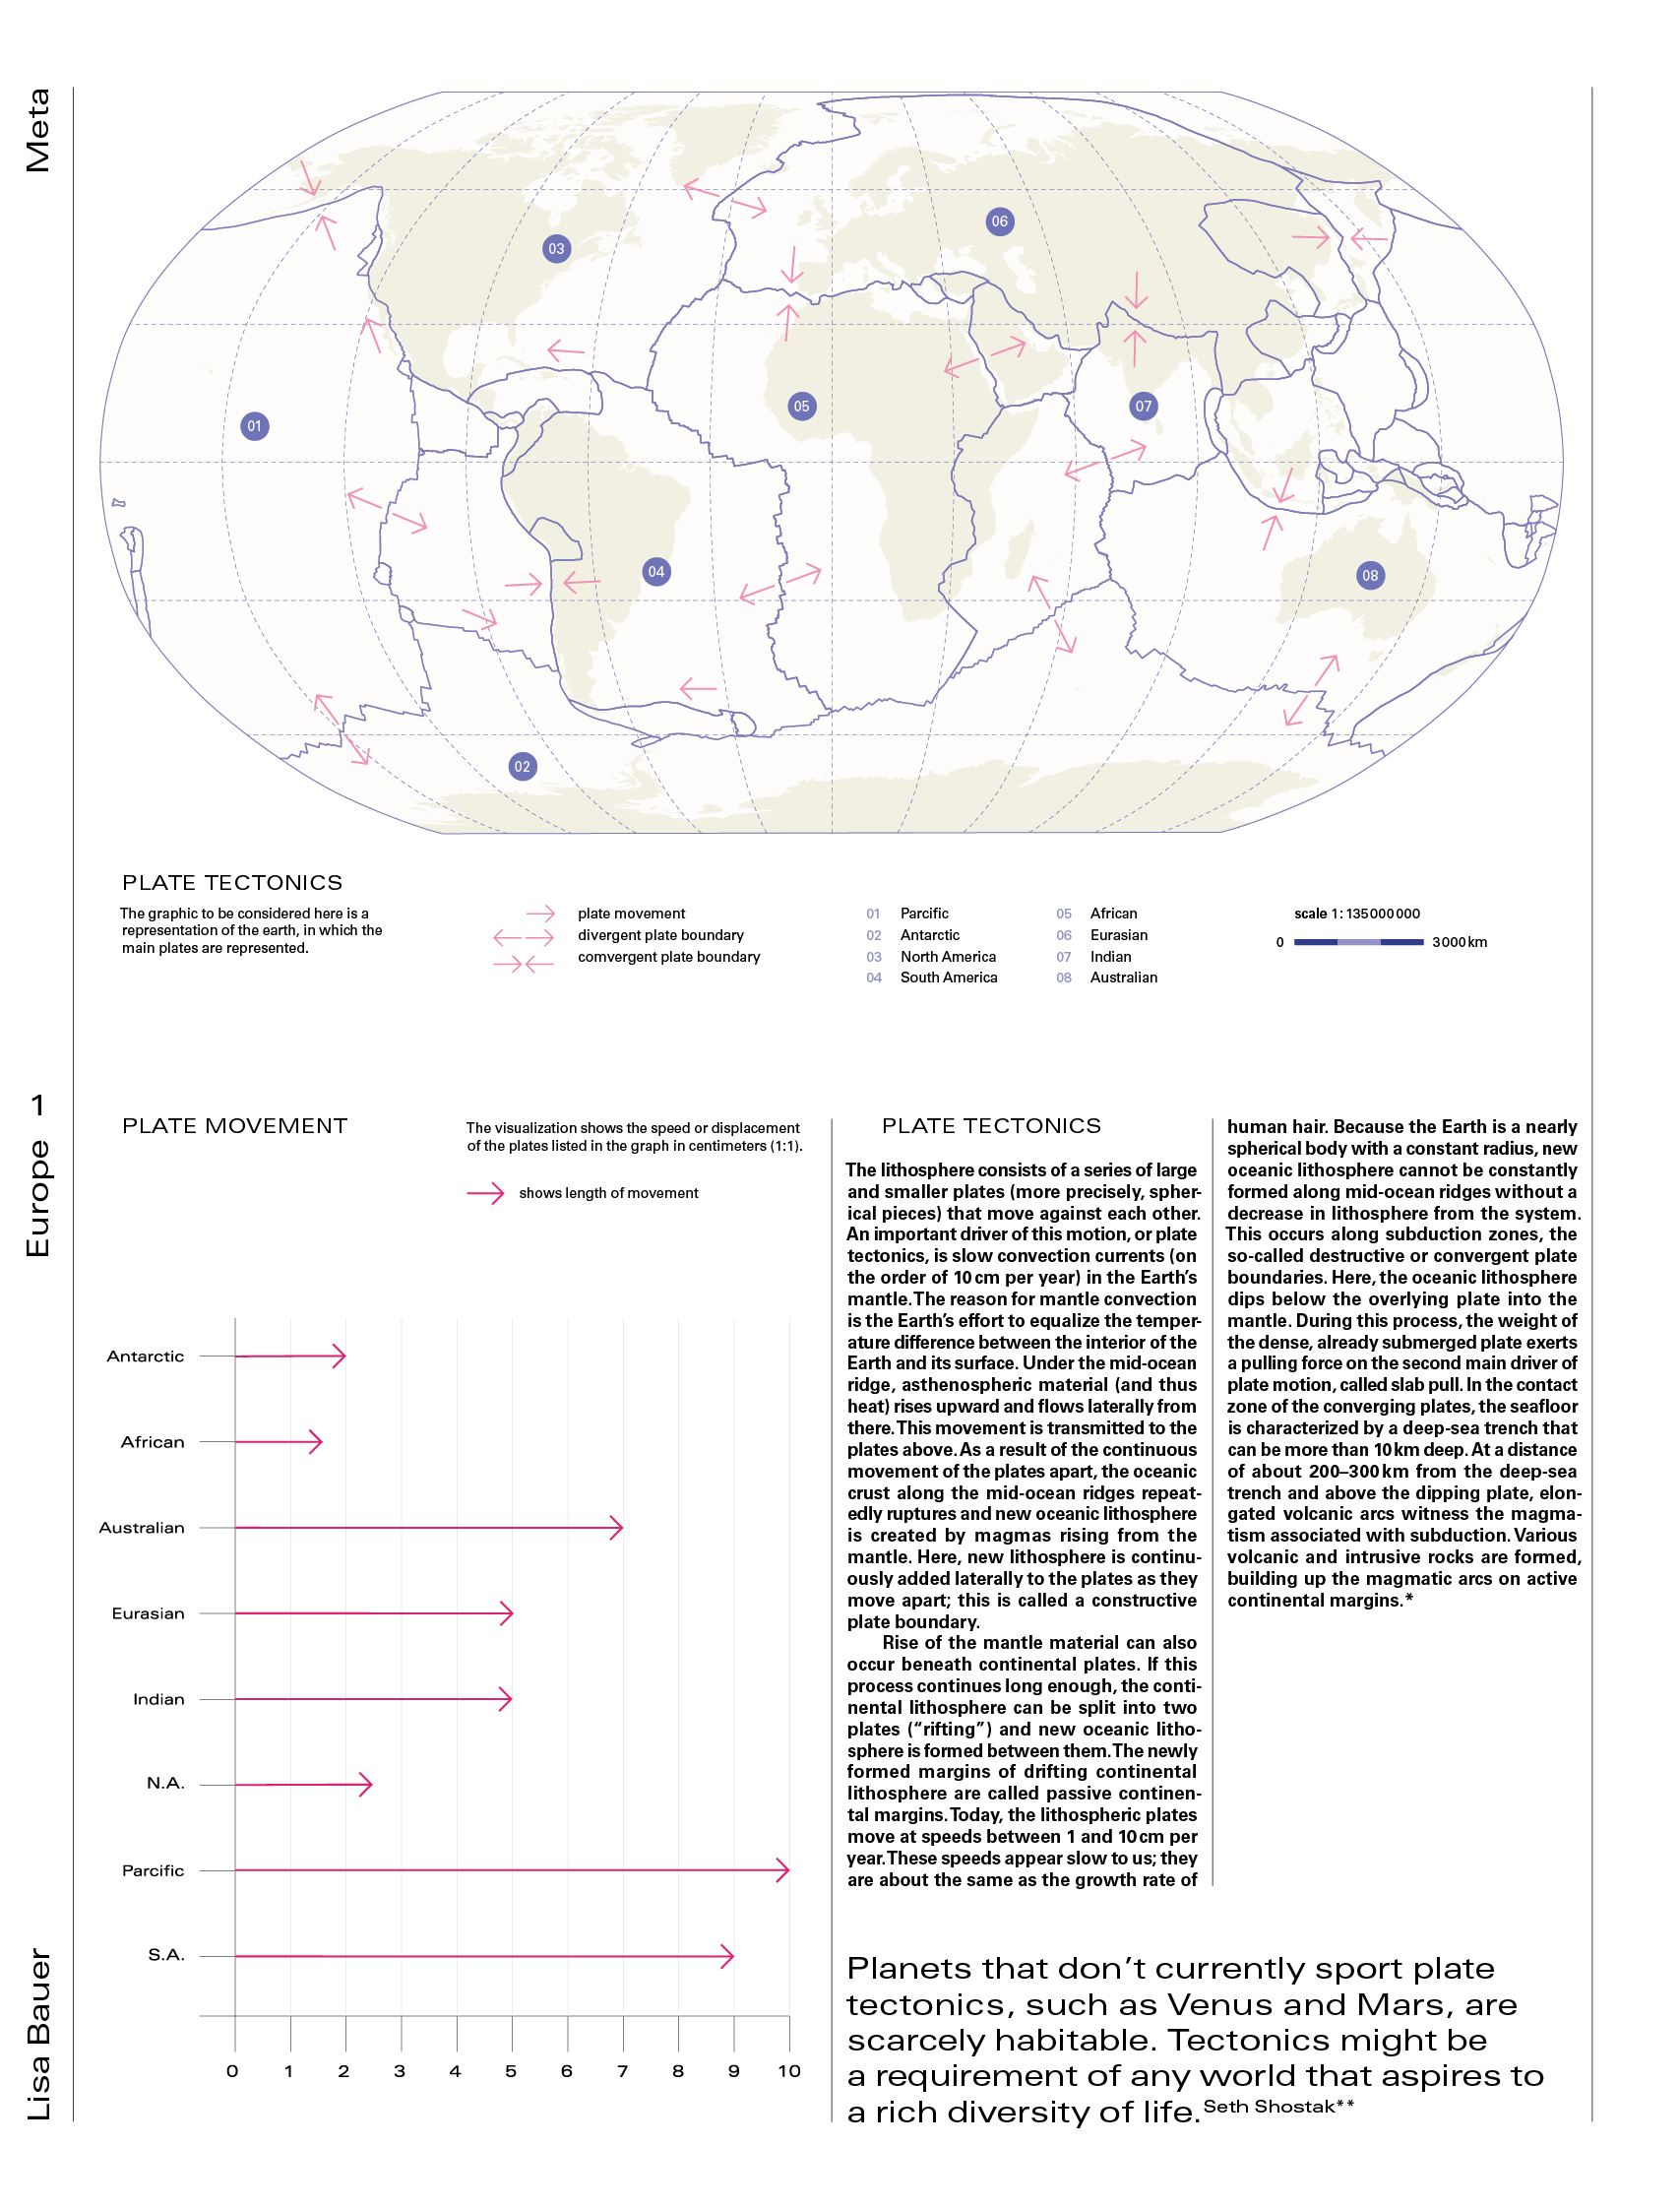
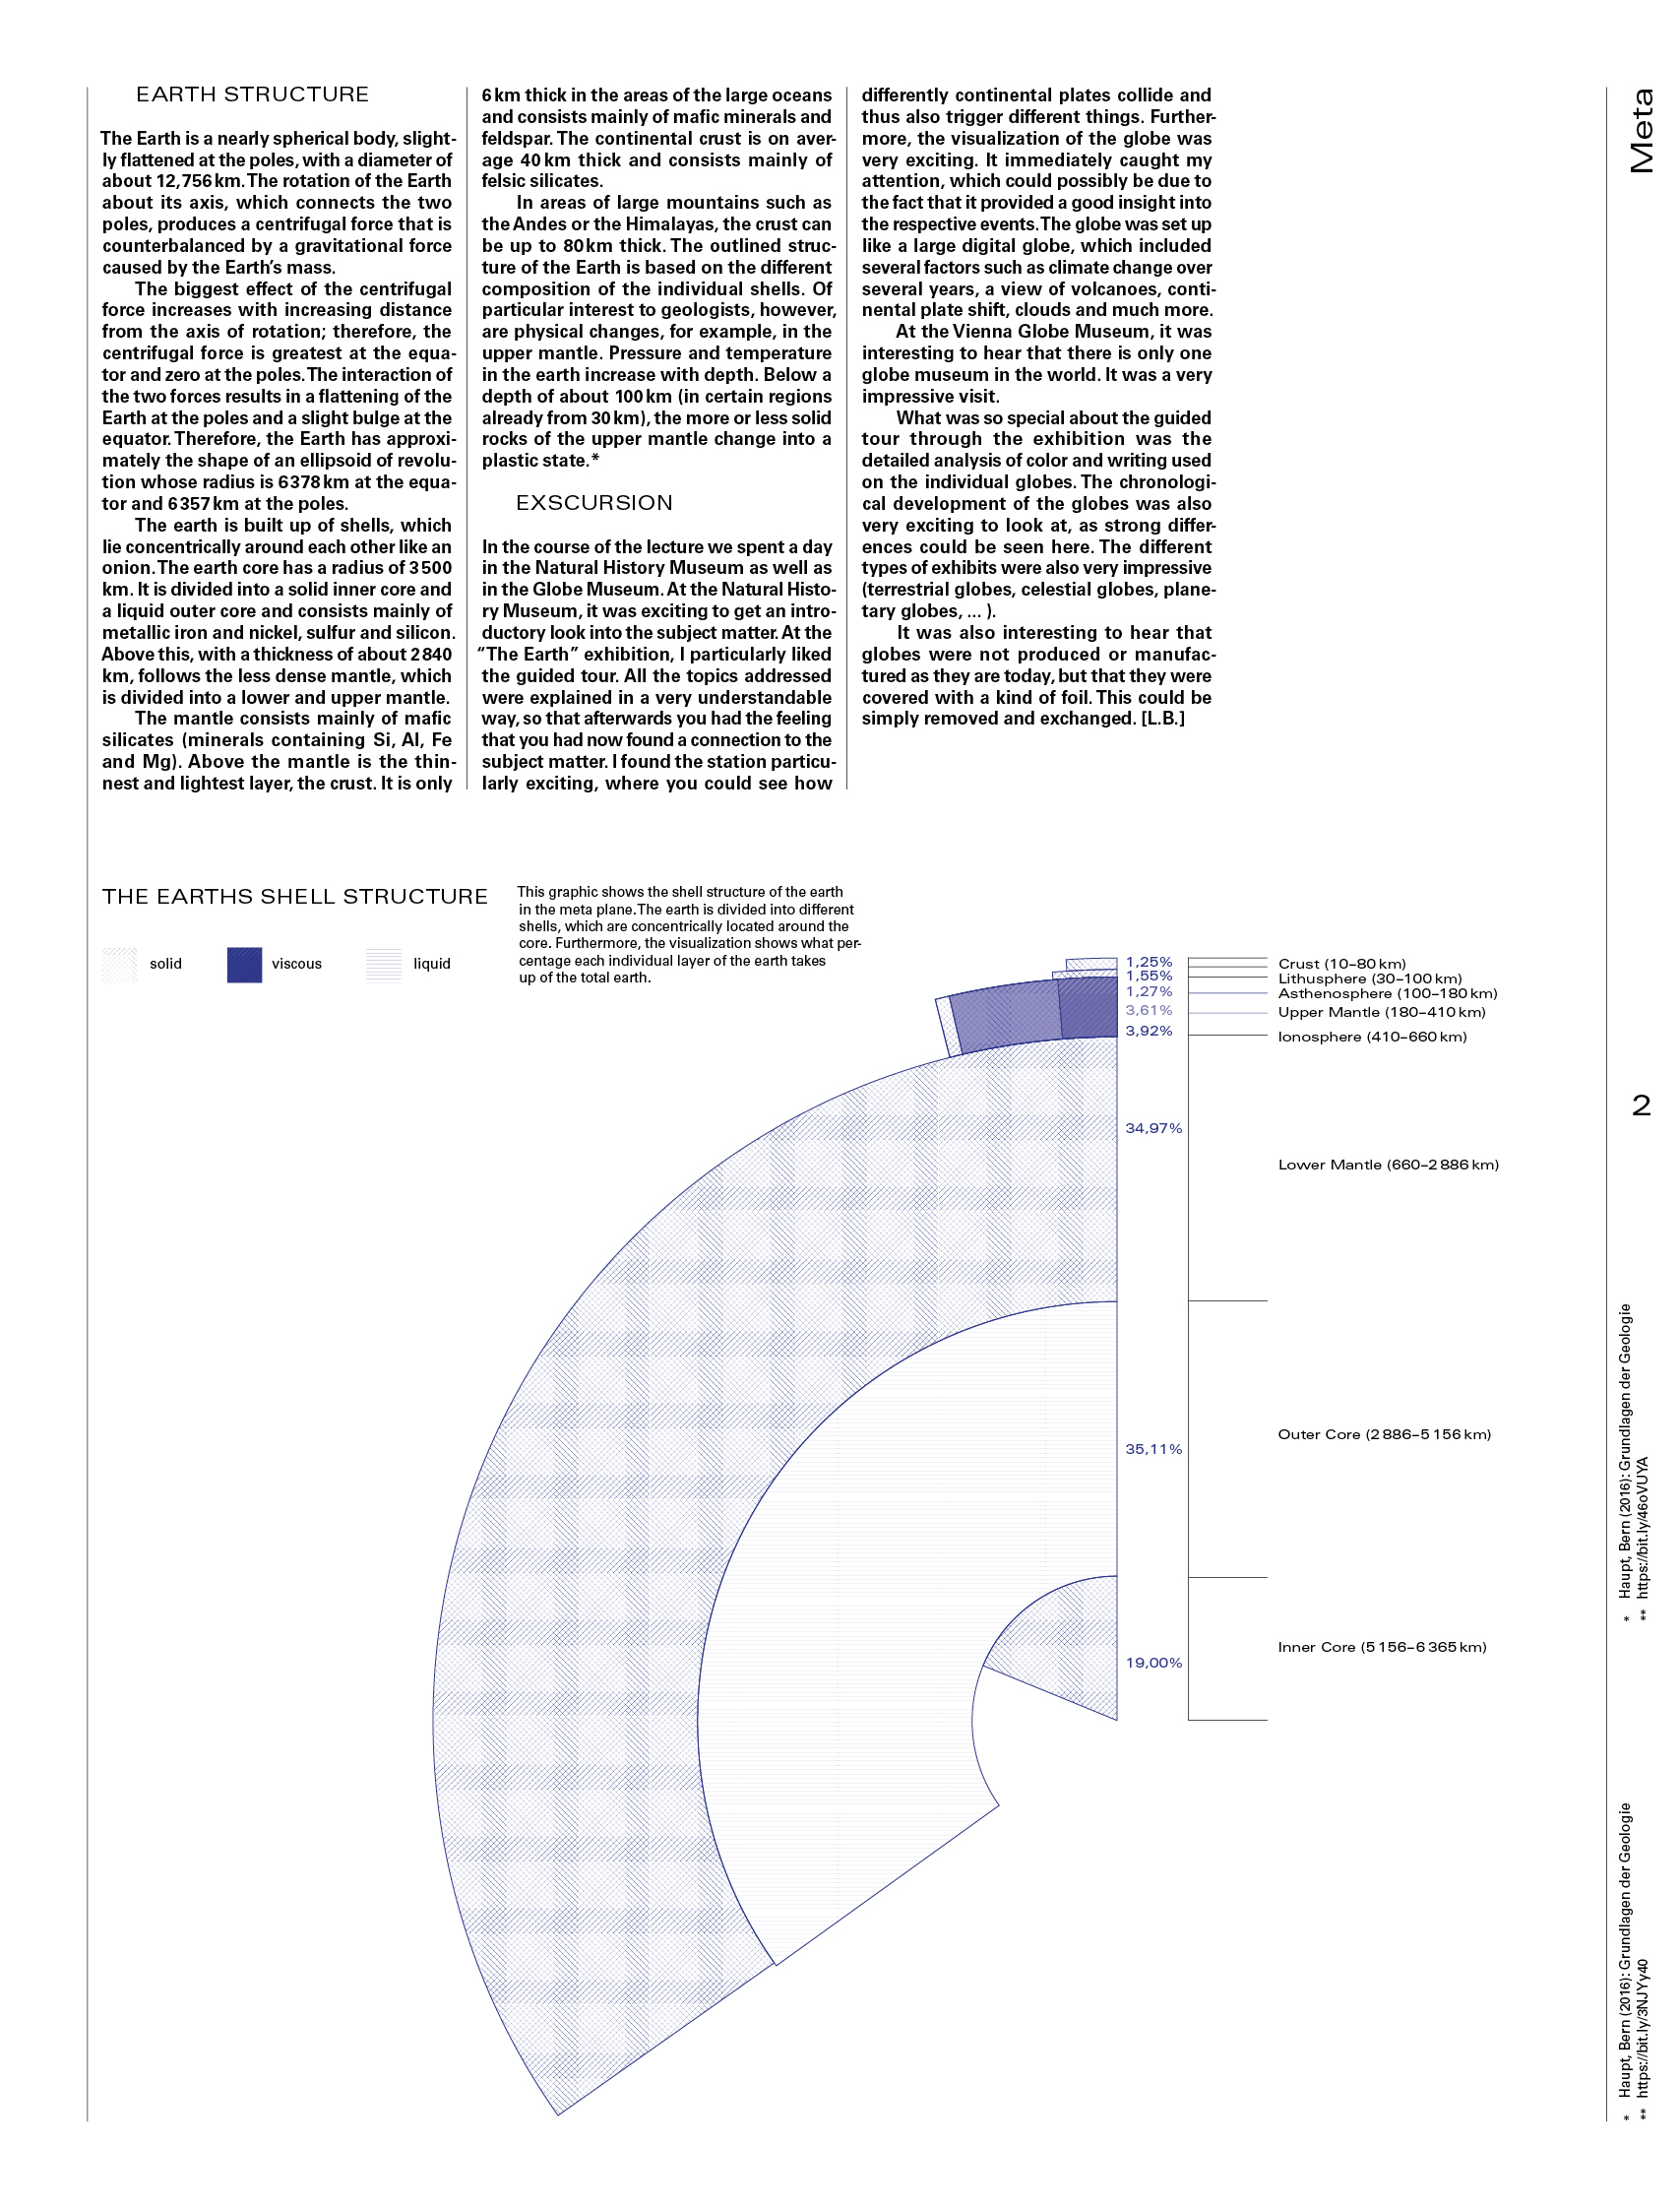
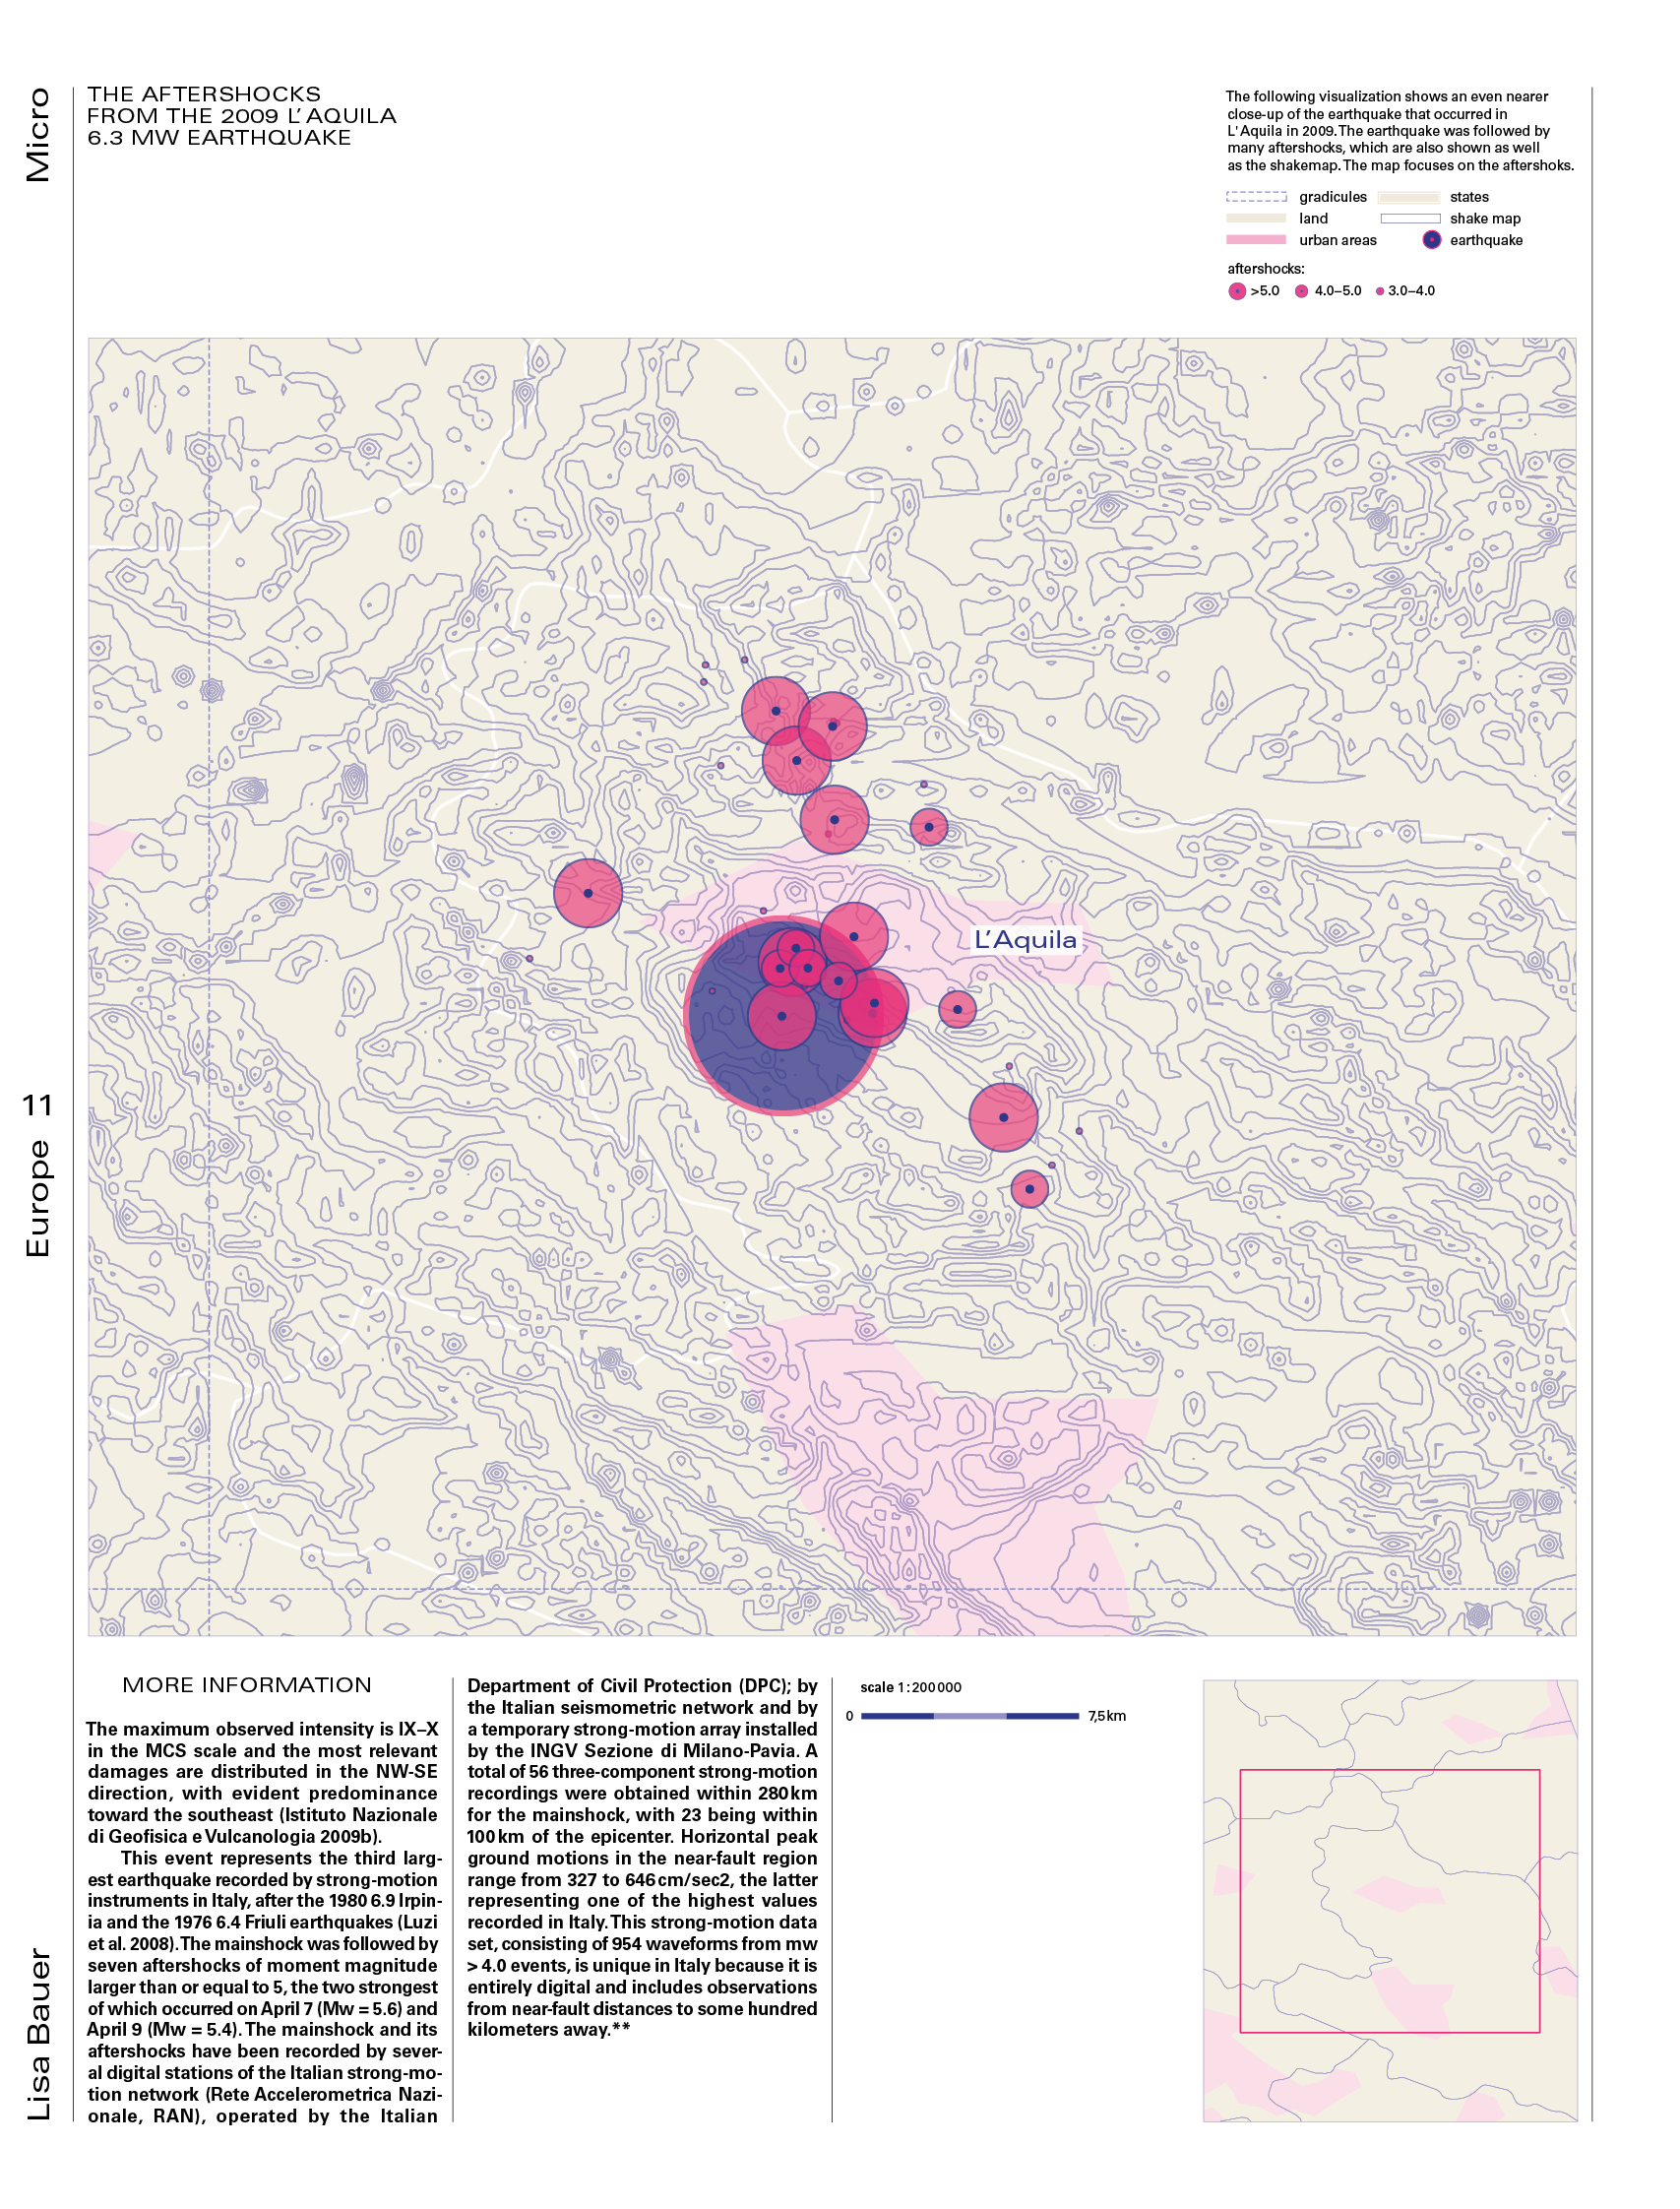
As part of the Data Visualisations: Mapping and Visualisations course, each student was assigned a continent, and I was given Europe. The main topic of the lecture was earthquakes, which we had to deal with in a variety of ways. Each level brought its own challenges, but I was also able to gain many valuable insights. When designing the micro level, I was faced with the task of presenting the tragic 2009 earthquake in L’Aquila (ITA), in an appropriate way. The meso level was particularly exciting for me as I was able to focus on Italy, a country that I know well personally and with which I have developed a special affinity over the last few years. It was a challenge to apply the previously used colours and patterns to a more detailed projection. The deeper I delved into the details, the more complex the visualisation became. When designing the macro and meta level, I worked with the open source programme QGIS for the first time and was initially overwhelmed by the numerous possibilities and the complex controls. It was a challenge to develop an appropriate visual language, especially as I had to visualise the different tectonic plates. The project was part of the overall Global Earthquake Atlas project led by Enrico Bravi.
| Data Visualisation: Mapping & Visual Analysis |
| New Design University |
| 2023 |


